Martingale Forex Strategy: How the 1-2-4-8 System Works and How to Manage Risk
Learn how the 1-2-4-8 martingale forex strategy works, calculate drawdown and margin risk, and compare it with fixed-risk and anti-Martingale sizing.

15 trading units are at risk after four 1-2-4-8 entries lose in sequence. That is the central problem with the martingale forex strategy: the first trade looks small, but recovery demands grow faster than most accounts can tolerate.
You need more than a position-sizing pattern. You need a defined market setup, maximum drawdown, margin check, and stop condition. Without those controls, one losing streak can turn a modest account into a forced liquidation.
Key Takeaways
- Four losses require 15 starting units
- Martingale does not improve trade accuracy
- Margin limits arrive before the math ends
- Set a hard losing-streak stop
- Fixed-risk sizing protects account longevity
- Anti-Martingale sizing rewards winning periods
What the 1-2-4-8 Martingale System Actually Does
The 1-2-4-8 system doubles your position after each losing trade. If your starting size is 0.01 lots, the next trades use 0.02, 0.04, and 0.08 lots. A winning trade is intended to recover earlier losses and add a profit equal to the first trade’s target.
That recovery works only under a narrow condition: the winning trade must produce enough money to cover every prior loss. The method does not predict the next market move. It changes the size of your next bet.
| Losing trades in sequence | Position units | Total units committed | Loss before the next trade |
|---|---|---|---|
| 0 | 1 | 1 | 0 |
| 1 | 2 | 3 | 1 |
| 2 | 4 | 7 | 3 |
| 3 | 8 | 15 | 7 |
| 4 | 16 | 31 | 15 |
The table assumes equal stop distance and equal value per unit. After four losses, a fifth trade needs 16 units, while the sequence has already exposed 15 units. The next position is larger than the entire original sequence.
The recovery equation
Suppose one unit risks $10. A first loss costs $10, the second costs $20, the third costs $40, and the fourth costs $80. The four-trade loss totals $150. A fifth trade at 16 units risks $160, so a win produces only $10 before spreads, commissions, and slippage.
That is the appeal and weakness in one example. You may recover the prior $150, but you are risking another $160 to earn a small net gain. Recovery is not the same as profit quality.
Why a win is never guaranteed
A losing trade does not make a winning trade more likely. Currency pairs can continue trending, reverse sharply, or remain volatile across several sessions. News involving interest rates, employment, or inflation can also push price through technical levels.
Treat the sequence as a risk-escalation experiment, not a proven market edge. If the entry signal has a 50% theoretical win rate, the previous result does not change the probability of the next independent signal.
How Much Capital Does 1-2-4-8 Need?
The capital requirement depends on risk per unit, stop distance, currency pair, account currency, and broker margin rules. The sequence alone cannot tell you whether an account is adequately funded. You must convert every position into a dollar loss and a margin requirement before placing trade one.
For a simple example, assume each unit risks $10 at its stop. The four positions in a 1-2-4-8 cycle risk $10, $20, $40, and $80. If all four lose, the account is down $150, and the next 16-unit position adds another $160 of risk.
Drawdown across losing streaks
Use this calculation:
Total loss = starting unit risk × (2n − 1)
Here, n is the number of consecutive losses. With a $10 starting risk, four losses equal $10 × (24 − 1), or $150. Five losses equal $310, and six losses equal $630.
| Consecutive losses | Next position | Cumulative loss at $10 per unit | Drawdown on a $2,000 account |
|---|---|---|---|
| 1 | 2 units | $10 | 0.5% |
| 2 | 4 units | $30 | 1.5% |
| 3 | 8 units | $70 | 3.5% |
| 4 | 16 units | $150 | 7.5% |
| 5 | 32 units | $310 | 15.5% |
| 6 | 64 units | $630 | 31.5% |
The sixth loss leaves $1,370 before trading costs or open-position losses. A small first trade does not create small account risk. It only delays the larger exposure.
Margin and leverage
Risk at the stop and required margin are separate numbers. A position may risk $160 at its stop but require several hundred dollars of usable margin. High leverage lowers the deposit needed to open a trade; it does not lower the loss if price reaches the stop.
Brokers also impose margin-call and stop-out levels. A 32-unit or 64-unit position may be mathematically valid but impossible to place because of available margin, maximum lot limits, or instrument-specific rules. Check the broker’s contract size, leverage, margin percentage, and stop-out policy before testing the sequence.
A practical account test
Before using the system, write down the largest permitted sequence. If you stop after four losses, your planned loss is $150 in the example above, and the next 16-unit order is forbidden. If that amount exceeds your account risk limit, reduce the starting unit or reject the method.
Do not fund the calculation with money needed for rent, debt payments, or emergency expenses. A strategy that requires you to tolerate a 15.5% drawdown after five losses is unsuitable for an account where a 5% decline already changes your decisions.
How Should You Set Stops and Account Risk Limits?
Set the stop before calculating the lot size, then set the maximum number of martingale steps before entering the first trade. A practical rule is to define a hard account loss limit, such as 2% or 5%, and reject any sequence whose worst-case loss exceeds that number.
For a deeper explanation of leverage, margin calls, slippage and the risks of oversized forex positions, read our guide to the risks of high leverage forex trading .
The percentage is a risk policy, not a promise of safety. A $2,000 account with a 5% cycle limit can lose $100. At $10 per unit, even four losses totaling $150 already exceed that limit.
Use a fixed stop distance
A 20-pip stop and a 60-pip stop produce different dollar risks at the same lot size. Position sizing must reflect both. The basic formula is:
Position size = account risk ÷ (stop distance × pip value)
If your permitted risk is $20 and one lot would lose $10 per pip at a 20-pip stop, the position size is 0.10 lots. Your broker’s calculator should confirm the pip value because it changes by pair and account currency.
Do not widen a stop to avoid realizing a loss. That changes the original risk calculation and may turn the next martingale level into a much larger account hit.
Define the stop conditions
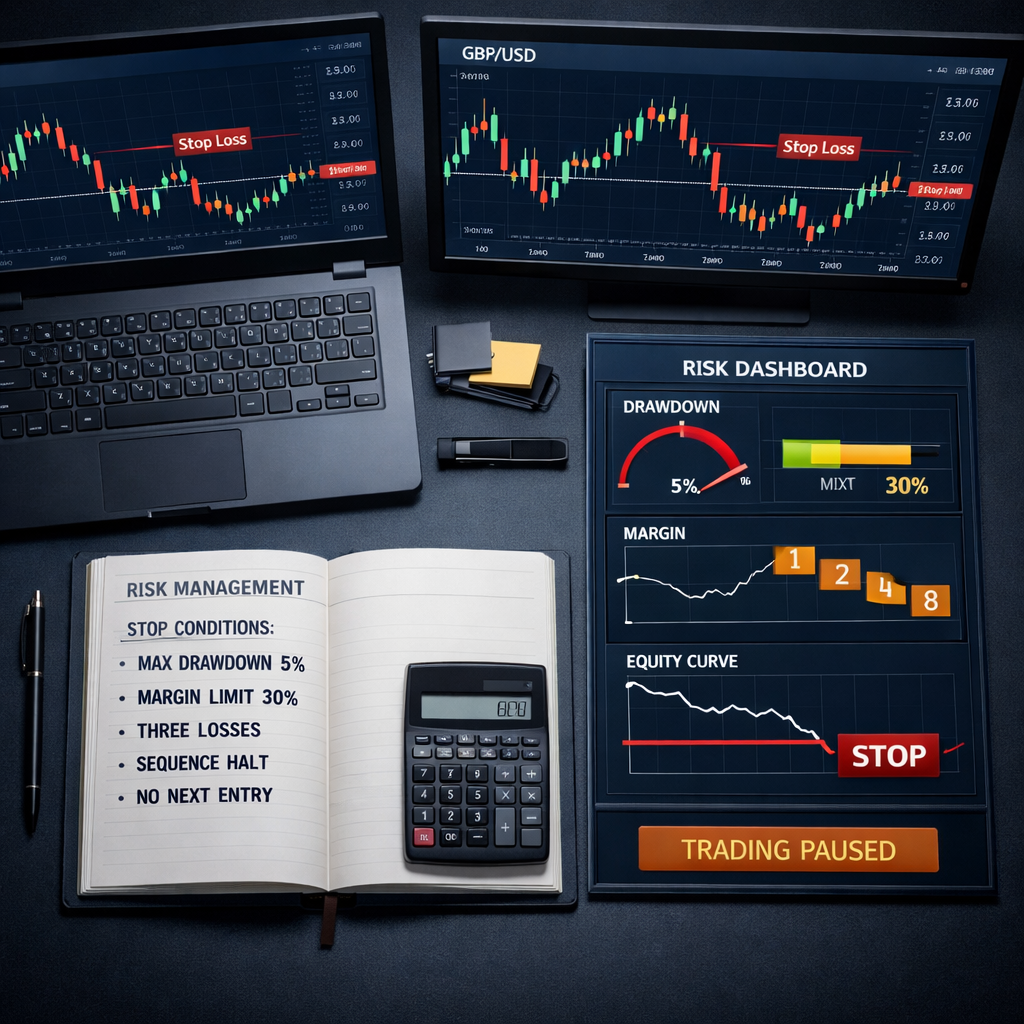
- Stop the sequence after a fixed number of losses.
- Stop when cycle drawdown reaches the account limit.
- Stop before available margin falls below your safety buffer.
- Stop trading during scheduled high-impact news if your system is not designed for it.
- Stop and review after abnormal spread or slippage.
A hard stop condition makes the strategy finite. Without one, the sequence has no mathematical endpoint except insufficient capital, a margin call, or a broker position limit.
Avoid hidden risk increases
Do not combine a doubled position with a wider stop, a second correlated currency pair, or a trade held through a major announcement. Those choices multiply exposure while the spreadsheet still shows only one martingale step.
Correlation matters. Long EUR/USD and long GBP/USD positions may respond to the same dollar move, so two separate trades can behave like one larger position.
When Does the Strategy Fail in Real Trading?
The martingale forex strategy fails when the next winning trade does not arrive before capital, margin, or patience runs out. The market does not need an extreme event. A normal trend lasting several entries can create the damaging sequence.
A stop-loss also does not guarantee the exact planned loss. Fast markets, weekend gaps, thin liquidity, and slippage can produce a worse fill. The gap between your assumed loss and actual loss becomes more important at the 8-unit, 16-unit, and 32-unit levels.
The signal problem
The 1-2-4-8 pattern is not a complete trading strategy. It does not specify trend direction, entry timing, stop placement, take-profit distance, spread tolerance, or conditions for avoiding a trade. Those decisions determine the actual expectancy.
A weak signal remains weak after four losses. Increasing size cannot repair a negative expectancy. Test the underlying entry method separately with fixed position size before adding any recovery rule.
The limit problem
A broker may cap the maximum trade size, reject an order because of insufficient margin, or reduce available leverage for a particular instrument. Even if the order is accepted, the required margin can rise when volatility or market conditions change.
For instance, a planned 32-unit trade may exceed the broker’s lot limit after three losses. The strategy then stops at the worst possible point: after exposure has grown but before recovery occurs.
The psychology problem
After three losses, traders often skip the next signal because the position looks too large. After a win, they may keep the enlarged size instead of returning to one unit. Both actions break the calculation.
The method demands mechanical execution, yet mechanical execution does not remove financial risk. If the required position makes you hesitate, the position is already too large for your account.
A stop order is an instruction to exit, not a guarantee of the exact execution price.
This distinction matters most during rapid price movement. Build a slippage allowance into your maximum-loss estimate instead of treating the stop price as a perfect boundary.
What Alternatives Are Safer for Most Forex Traders?
For most traders, fixed-risk position sizing is the better starting point. Risk the same account percentage on every trade, such as 0.5% or 1%, and reduce the lot size when the stop becomes wider. This prevents a losing streak from automatically increasing exposure.
The main drawback is slower recovery. After three losses, a fixed-risk method does not attempt to win back the full amount on the next trade. That feels less aggressive, but it keeps the next decision affordable.
Fixed-risk sizing

With a $2,000 account and a 1% risk limit, each trade risks $20. After five losses, the simple dollar loss is $100 before changing balance effects. The sixth trade still risks about $20, not $320.
Recalculate after meaningful balance changes rather than after every small fluctuation. A weekly review is practical for many discretionary traders, while automated systems should calculate risk from current equity before each order.
Anti-Martingale sizing
An anti-Martingale approach increases size after wins and reduces it after losses. A trader might use one unit after a loss, two after one win, and return to one after a loss. This places more capital behind a favorable run without trying to force recovery from a losing run.
The drawback is that a winning streak can end abruptly, so the enlarged trade still needs a stop and a size cap. Anti-Martingale is a money-management choice, not proof that the signal has predictive power.
A simple comparison
| Method | After a loss | Main benefit | Main danger |
|---|---|---|---|
| Martingale | Double position | Fast theoretical recovery | Exponential drawdown |
| Fixed risk | Keep account-based risk | Stable exposure | Slower recovery |
| Anti-Martingale | Reduce or reset size | More exposure during wins | Giveback after reversal |
Choose fixed risk when account survival is the priority. Choose anti-Martingale only when you have tested the signal’s behavior during sustained trends. Use 1-2-4-8 as a bounded experiment, never as an automatic response to every loss.
How Can You Test a Martingale Forex Strategy Properly?
Test the entry signal first, then test the sizing rule under realistic costs. A backtest that ignores spread, commission, slippage, rejected orders, and maximum lot size will make the sequence look safer than it is.
Use a spreadsheet or a TradingView strategy script to record each trade’s entry, stop, result, position size, spread assumption, and account equity. Pine Script can automate the arithmetic, but it cannot create a valid edge or guarantee broker execution.
Build the test rules
Your test should state the currency pair, timeframe, trading hours, stop distance, target distance, entry condition, and maximum martingale level. If one detail changes between trades, record the reason rather than quietly altering the system.
Run at least two separate views: a trade-by-trade result list and an equity curve. The equity curve shows whether a short recovery sequence hides a damaging fall in account value.
Stress the losing streak
Do not test only the historical order of trades. Reorder the same wins and losses into harsher sequences, then apply your position-sizing rules. A system with ten losses spread across 100 trades behaves differently from ten losses concentrated in 12 trades.
Add scenarios for a 20% wider stop, one missed fill, and a spread increase during a news event. If the account fails under a plausible scenario, lower the starting size or remove the martingale layer.
Review the decision points
Record the largest position, peak drawdown, margin used, longest losing streak, and number of cycles stopped by the risk rule. These figures tell you more than the percentage of winning trades.
Platforms such as TradingView can support chart-based testing, while a broker’s demo account can expose order-size and margin restrictions. A demo result still does not prove live fills, but it can reveal invalid assumptions before real money is involved.
A single attractive month is not enough evidence. Require a rule set that remains acceptable after costs and adverse sequencing, or use fixed-risk sizing instead.
If you are also interested in the business side of forex trading and brokerage partnerships, read our guide to the{' '} Best Trading Affiliate Program .
Conclusion
Use the 1-2-4-8 sequence only as a capped experiment with a tested entry signal, fixed stops, and a written loss limit. If four losses would exceed your account’s allowed drawdown, reject the system before placing the first trade. For most beginners, fixed-risk sizing is the better choice because it keeps the next trade from becoming the largest decision in the account.
Frequently Asked Questions
Does a martingale forex strategy guarantee recovery after a loss?
No. Recovery requires a winning trade before capital, margin, or broker limits stop the sequence. A 1-2-4-8 cycle that reaches four losses has already used 15 starting units, and the next 16-unit trade may be impossible or too risky to place.
How many martingale levels should I use?
Set the level from your account risk limit, not from a preferred number. If a $2,000 account permits a $100 cycle loss and each unit risks $10, four losses totaling $150 already exceed the limit, so the sequence should stop earlier or be abandoned.
Is high leverage required for the 1-2-4-8 method?
No. Leverage affects margin requirements, not the dollar loss at your stop. High leverage can make a large position easier to open, but it does not make a 32-unit or 64-unit trade safer when price moves against you.
What is the best alternative to martingale sizing?
Fixed-risk sizing is the strongest default for beginners and intermediate traders. Risk a set account percentage, such as 1%, on each trade, then adjust the lot size to the stop distance. This keeps a losing streak from automatically multiplying your exposure.